Generating a 3D topographic map of the Moon
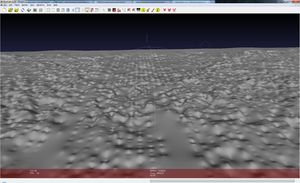
In a short moment of stuffiness I read about NASA's Clementine Mission, which was launched in 1994. The Clementine spacecraft made several lunar observations, including a LIDAR (Laser Image Detection and Ranging) scan of the Moon's surface. The data of this LIDAR scan is available from NASA's Planetary Data System. I had the idea to generate a 3D model of the Moon's surface — this article shows the results.
If you are interested in this topic, probably my Master's Thesis »Development of an illumination simulation software for the Moon's surface: An approach to illumination direction estimation on pictures of planetary solid surfaces with a significant number of craters.« will be of interest for you. Instead of using the imprecise Clementine mission topographic data, the NASA Lunar Reconnaissance Orbiter (LRO) mission LIDAR data (up to a few meters per pixel in resolution) is used in my master's thesis to generate a global 3D model of the Moon's surface. |
In a short moment of stuffiness I read about NASA's Clementine Mission, which was launched in 1994. The Clementine spacecraft made several lunar observations, including a LIDAR (Laser Image Detection and Ranging) scan of the Moon's surface. The data of this LIDAR scan is available from NASA's Planetary Data System. I had the idea to generate a 3D model of the Moon's surface — this article shows the results.
Obtaining the data
At first I searched for the right data file and found topogrd2.dat in the topo directory. The label file (called topogrd2.lbl) gives information about the data file:
PDS_VERSION_ID               = "PDS3"

RECORD_TYPE                  = FIXED_LENGTH
RECORD_BYTES                 = 84
FILE_RECORDS                 = 103680
^ARRAY                       = "TOPOGRD2.DAT"

SPACECRAFT_NAME              = "CLEMENTINE 1"
TARGET_NAME                  = "MOON"
INSTRUMENT_NAME              = "LIDAR"
DATA_SET_ID                  = "CLEM1-L-LIDAR-5-TOPO-V1.0"
PRODUCT_ID                   = "TOPOGRD2-DAT"
PRODUCT_RELEASE_DATE         = 1996-01-01
DESCRIPTION                  = "This file contains a digital,
0.25 X 0.25 degree resolution grid of the topography of the Moon
relative to a spheroid of radius 1738 km at the equator, with
a flattening of 1/3234.93.  The data are interpolated from the
filtered observations by the 'blockmean and surface programs' of
the GMT-system of Wessel and Smith (EOS, Transactions American
Geophysical Union, v.72, p. 441-446, 1991).  It is a 1440 X 720
grid from 89.875 to -89.875 degrees latitude, and 0.125 to
359.875 degrees longitude.  No attempt has been made to provide
data at the poles (i.e. beyond about 78 degrees), since the
numbers are unconstrained.  The observation is topography in
meters."

OBJECT                   = ARRAY
  NAME                       = "2-D GRID OF TOPOGRAPHY"
  INTERCHANGE_FORMAT         = ASCII
  AXES                       = 2
  AXIS_ITEMS                 = (720,1440)
  AXIS_NAME                  = ("LATITUDE","LONGITUDE")
  AXIS_UNIT                  = (DEGREES,DEGREES)
  AXIS_INTERVAL              = (0.25,0.25)
  FORMAT                     = "F8.1"
  SAMPLE_BITS                = 64
  DESCRIPTION                = "This is a 2-D grid of the
  topography of the Moon in meters"
END_OBJECT               = ARRAY

END
The data file contains pre-processed instrument data from the Clementine LIDAR. In fact the height difference between a perfect spheroid of radius $r$ with $r = 1.738\E{6}\,\text{m}$ and flattening $f$ with $f = \frac{1}{3234.93}$ and the real measured height is given for the polar coordinates $(\vartheta,\varphi)$ with $\vartheta \in [-89.875^\circ, 89.875^\circ]$ and $\varphi \in [0.125^\circ, 359.875^\circ]$ in steps of 0.25 degrees, whereas $\vartheta$ is the latitude and $\varphi$ the longitude of the Moon.
We first need to process the data in a format, which can be read by a meshing tool like MeshLab.
Processing the data into a 3D point cloud
First of all we need to know something about the original data format. The file stores the height differences in meters in 103680 lines, whereas one line consists of ten values separated by spaces. The first value is the height difference at $(\vartheta, \varphi) = (89.875^\circ, 0.125^\circ)$. For each next value the longitude is increased by $0.25^\circ$, the step size, until the longitude reaches $\varphi = 359.875^\circ$. After that the latitude is decreased by $0.25^\circ$ and the longitude starts again to run from $\vartheta = 0.125^\circ$. So the second value is for the position $(89.875^\circ, 0.375^\circ)$, the third for $(89.875^\circ, 0.625^\circ)$ and so on.
I decided to use PHP for this data processing, because thereby a really fast development of a working converter script is possible. A fast separation of the particular values is achieved with use of an regular expression (short »regexp«). I used the following regexp pattern to separate the values line-by-line:
^[\s]+([-]?[0-9]+[.]{1}[0-9]+)[\s]+([-]?[0-9]+[.]{1}[0-9]+)[\s]+([-]?[0-9]+[.]{1}[0-9]+)[\s]+([-]?[0-9]+[.]{1}[0-9]+)[\s]+([-]?[0-9]+[.]{1}[0-9]+)[\s]+([-]?[0-9]+[.]{1}[0-9]+)[\s]+([-]?[0-9]+[.]{1}[0-9]+)[\s]+([-]?[0-9]+[.]{1}[0-9]+)[\s]+([-]?[0-9]+[.]{1}[0-9]+)[\s]+([-]?[0-9]+[.]{1}[0-9]+)[\s]+$After the separation of all values it is quite easy to generate a new file consisting of one triplet for one 3D point each line. For a 3D topography map on a plane, the mapping $$x = \vartheta,\ y = \varphi,\ z = \delta(\vartheta, \varphi) \cdot \frac{1}{30\,333.8224}$$ can be used, where $\delta(\vartheta, \varphi)$ is the measured height difference to the ideal spheroid at the location $(\vartheta, \varphi)$. Such a map will show the surface height differences in their natural magnitude (consideration: The major circumference $R$ of the spheroid is $R = 2\pi \|r\| = 10\,920\,176.06\,\text{m}$, which is mapped into an angle of $360^\circ$. So $1\,\text{m}$ is equivalent to $\frac{1^\circ}{30\,333.8224}$, which is the factor above for $z$).
Because the height differences are really small compared to the spheroid, I will multiply the height differences by 10: $$x = \vartheta,\ y = \varphi,\ z = \delta(\vartheta, \varphi) \cdot \frac{10}{30\,333.8224}$$
The PHP script I wrote:
<?php

    ini_set('memory_limit', '512M');    // increase PHP's memory limit to 512 MB

    $file = file("topogrd2.dat");       // read the data file
    $res = 0.25;                        // horizontal/vertical step size in deg
    $lat_start = 89.875;                // first latitude value in the file (deg)
    $lat_end = -89.875;                 // last lititude value in the file (deg)
    $lat_n = 720;                       // number of steps in latitude at the given
                                        // resolution; could even be calculated by
                                        // abs($lat_end - $lat_start)/$res + 1
    $long_start = 0.125;                // first longitude value in the file (deg)
    $long_end = 359.875;                // last longitude value in the file (deg)
    $long_n = 1440;                     // number of steps in longitude at the given
                                        // resolution; could even be calculated by
                                        // abs($long_end - $long_start)/$res + 1

    $moon_r = 1738000;                  // Moon radius in m
    $moon_f = 1/3234.93;                // Moon flattening


    $raw_data = array();                // build a raw-data array, containing
                                        // the $lat_n * $long_n = 1'036'800 altitude
                                        // values (without any mapping)

    // separate the values in each single line of the file
    foreach($file as $line)
    {
        // read line and separate values using regexp
        preg_match_all("/^[\s]+([-]?[0-9]+[.]{1}[0-9]+)[\s]+([-]?[0-9]+[.]{1}[0-9]+)[\s]+([-]?[0-9]+[.]{1}[0-9]+)[\s]+([-]?[0-9]+[.]{1}[0-9]+)[\s]+([-]?[0-9]+[.]{1}[0-9]+)[\s]+([-]?[0-9]+[.]{1}[0-9]+)[\s]+([-]?[0-9]+[.]{1}[0-9]+)[\s]+([-]?[0-9]+[.]{1}[0-9]+)[\s]+([-]?[0-9]+[.]{1}[0-9]+)[\s]+([-]?[0-9]+[.]{1}[0-9]+)[\s]+$/", $line, $matches);

        for($i = 1; $i <= 10; $i++)
        {
            // store each value in $raw_data
            $raw_data[] = $matches[$i][0];
        }
    }

    // free memory (the file contents are not needed anymore, since the single
    // values are stored in $raw_data now
    unset($file);

    $data2d = array();                  // build a data array for a plane projection
    $data3d = array();                  // build a data array for a spheroid projection
    $i = 0;                             // initialize value index

    // map each value to a certain longitude/latitude pair
    for($lat = $lat_start; $lat >= $lat_end; $lat = $lat - $res)
    {
        for($long = $long_start; $long <= $long_end; $long = $long + $res)
        {
            // set the altitude difference
            $altitude_diff = $raw_data[$i];

            // calculations for the plane projection (2D)
            $z = $altitude_diff * (1/30333.8224) * 10;
            $data2d[] = "{$long},{$lat},{$z}\r\n";

            // calculations for the spheroid projection (3D)
            $x = ($moon_r + $altitude_diff) * cos(deg2rad($lat)) * cos(deg2rad($long));
            $y = ($moon_r + $altitude_diff) * cos(deg2rad($lat)) * sin(deg2rad($long));
            $z = ($moon_r + $altitude_diff) * (1 - $moon_f) * sin(deg2rad($lat));
            $data3d[] = "{$x},{$y},{$z}\r\n";

            // increase value index by one
            $i++;
        }
    }

    // free memory (the raw data is now not needed anymore)
    unset($raw_data);

    // generate output files
    file_put_contents("topogrd2_2D.asc", $data2d);
    file_put_contents("topogrd2_3D.asc", $data3d);

    print("finished!");

?>
Additionally, the script generates a file with coordinates for a 3D spheroid with the following mapping: $$x = (r + \delta(\vartheta, \varphi)) \cos \vartheta \cos \varphi,\quad y = (r + \delta(\vartheta, \varphi)) \cos \vartheta \sin \varphi,\quad z = (r + \delta(\vartheta, \varphi)) \cdot (1-f) \cdot \sin \vartheta$$
A derivation of this mapping can be found here (section »Parametrisierung der Erde als Kugel«; at the moment only in German available).
The PHP script generates two files: topogrd2_2D.asc (map projection on a plane) and topogrd2_3D.asc (spheroid model). Both can be read with MeshLab.
Generating a mesh from the 3D point cloud with MeshLab
At the moment we have only a 3D point cloud of the Moon's surface. To get a closed surface, we need to generate a mesh. MashLab was used to produce that closed surface. Steps to reproduce:
- Open MeshLab, an empty project and import
topogrd2_2D.asc(no header row to be skipped, grid triangulation enabled). - Goto
Filters»Point Set»Compute normals for point sets. - Set number of neighbors to 10, viewpoint position is $(0,0,1)$. Apply the filter.
- Goto
Filters»Remashing, simplification and reconstruction»Surface Reconstruction: Ball Pivoting. - Set pivoting ball radius to autoguess (0 for abs and %), clustering radius to 20% and angle threshold to 90 degrees. Apply the filter.
- Goto
Filters»Color Creation and Processing»Per Vertex Color Function. - Set each of func r, func g, func b to 150. Apply the filter.
We have now a closed 3D surface of the Moon's topography. Export the mesh (select File » Export Mesh As...) in Stanford Polygon File Format (*.ply).
If you would like to have a color coded topography:
- Goto
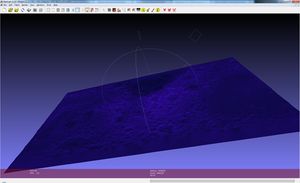
Filters»Color Creation and Processing»Per Vertex Color Function. - Set func r = 30+z*10, func g = 10, func b = 120+z*25 (you can experiment with different values). Apply the filter.
For the spheroid model you can do the same, but you need another color function if you would like to have a color coded topography. Proposal: 100+((sqrt(x^2+y^2+z^2)-1738000)/80).


 Science


